This (old) post originally appeared on the website of Infi, the company I co-founded in 2003.
At Infi, we have something similar to Google’s 20 Percent Factor. If you have a great idea or something you want to know more about, you can spend time on it during work hours. The subject we’re currently interested in is augmented reality.
We (Corné and Reinder) started with looking for existing AR frameworks and found one interesting open-source project: ARToolkit (plus). This toolkit is written in C/C++ but also ported to flash en used in many AR demos you can find on the internet.
Unfortunately, the algorithm used for the detection of markers in this toolkit has some downsides:
- It is not very fast.
- It is not very good at detecting markers having an edge or corner (partial) occluded.
- It is based on a thresholding algorithm and therefore performs not very well under changing or not homogeneous lighting conditions.
There are some successors of ARToolkit, using edge-based detection algorithms (like ARTag and Studierstube Tracker) but these are closed-source libraries.
In 2008, Martin Hirzer wrote ‘Marker Detection for Augmented Reality Applications’ [1], an article explaining an edge-based marker-detection algorithm. We decided to implement this algorithm in C++.
At the moment our code is just a prototype. Eventually (after a cleanup) we will open-source our implementation and/or donate it to the ARToolkit code base.
Marker detection in action.
In this blog post, we explain the implemented algorithm.
Algorithm
Step 1: Divide image in regions
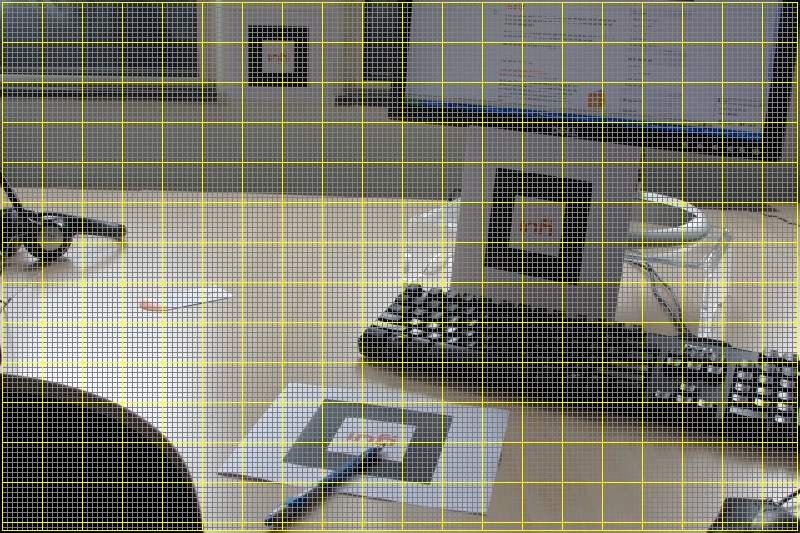
First, the image is divided into small regions of 40×40 pixels and each region is divided into horizontal and vertical scan lines 5 pixels apart.
The next 3 steps are executed apart inside these regions which boosts the performance dramatically.
Step 2: Detect edgels in regions
Then a derivative of Gaussian is convolved on each scan line to estimate the component of the intensity gradient along the scanline.
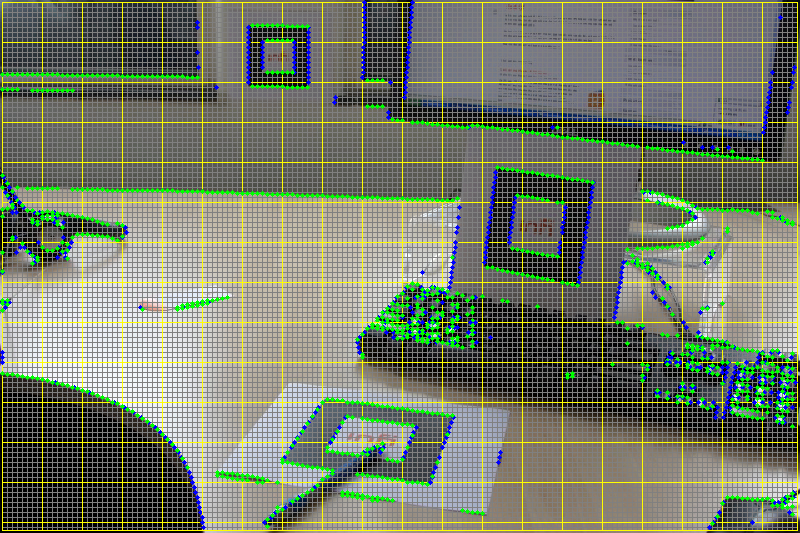
This Gaussian derivative is used to detect black/white edges in the image. The Gaussian derivative is based on convolving the image with a small, separable, and integer-valued filter in a horizontal and vertical direction and is therefore relatively inexpensive in terms of computations. Local maxima along the scanlines stronger than a certain threshold (for all three colour channels!) are considered to be edgels.
The Gaussian derivative kernel used, is given by:
[ -3 -5 0 5 3] * A
If an edgel is detected, the Sobel operator is used to determine the orientation of the edgel. The Sobel operator is given by:
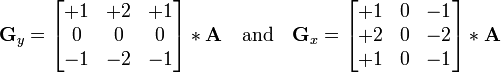
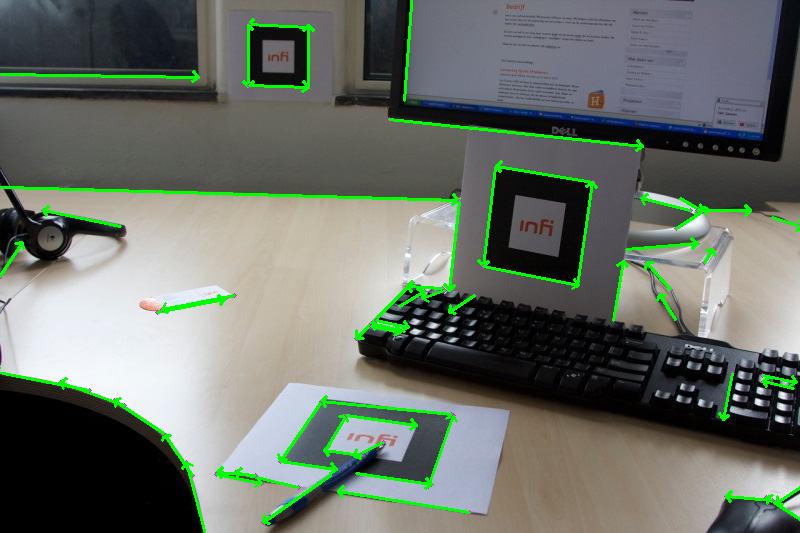
The orientation is then saved with the edgel. In the image above, the green dots are horizontally orientated edgels and the blue ones are vertically orientated edgels.
Step 3: Find segments in regions
After the detection of the edgels, a RANSAC-grouper algorithm is used to construct line segments in each region [2].
RANSAC is an abbreviation for “RANdom SAmple Consensus”. It’s an algorithm to find groups of “inliers”, i.e. points which can be fitted into a line.
The RANSAC algorithm in short:
- Randomly choose 2 points from the same region, whose orientations are compatible with the line joining the two points, to hypothesize a line.
- The number of points supporting each line is counted. To be considered part of a line a point must lie close to it and have a compatible orientation with the line.
- Steps 1 and 2 are repeated ~25 times before a segment is found.
- Lines with enough support (at least 4 segments) are considered detected lines. Steps 1 to 3 are repeated until all such lines have been found.
More about RANSAC: http://en.wikipedia.org/wiki/RANSAC.
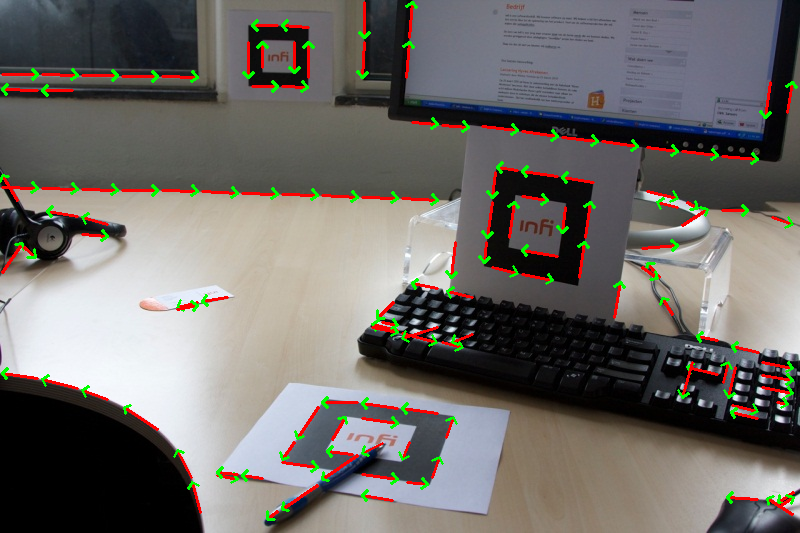
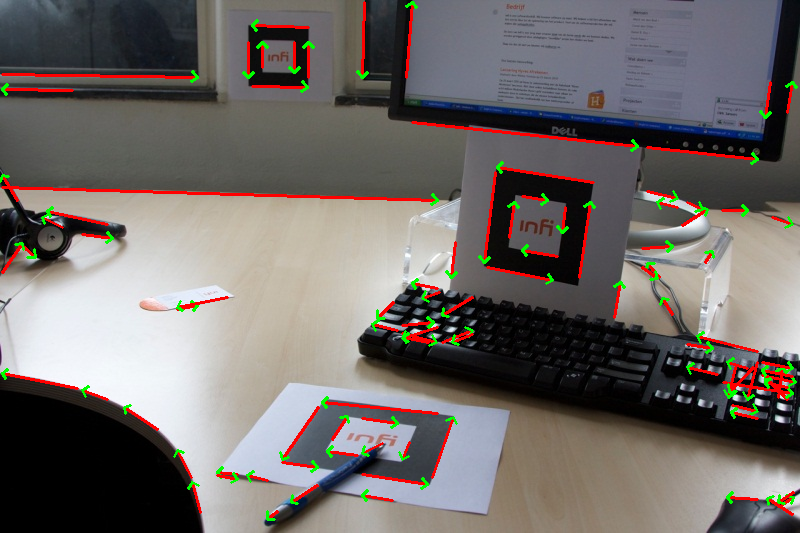
Because we know the orientation of the edgels from step 2, we can give the line segments an orientation. In the image above, the constructed segments are displayed as red and green arrows.
Step 4: Merge segments to lines
In this step, the segments are merged into lines.
Two segments are merged if:
- The orientations are compatible.
- The segments are close to each other.
- If the pixels along the line between the two segments are on an edge, using the same edgel detection criteria as used in step 2.
First, all segments are tested in their own region using this algorithm. When all possible segments are merged in their own region, the same operation is repeated for all segments in the whole image.
The merged lines are displayed as red/green arrows in the image above.
Step 5: Extend lines along edges
In this step, the lines are extended along the edges.
Because we scan only pixels on scan lines 5 pixels apart, it’s inevitable that the merged lines don’t fit on the entire length of the edge of a marker. So in this step, we extend the detected lines pixel by pixel until we detect a corner:
- Extend each end of a line and check if each pixel is on an edge, using the same edgel detection criteria as used in step 2. Do this until we hit a pixel that’s not an edge.
- Take a pixel a couple of pixels further. If this pixel is ‘white’, we might have a found a corner of a black on white marker.
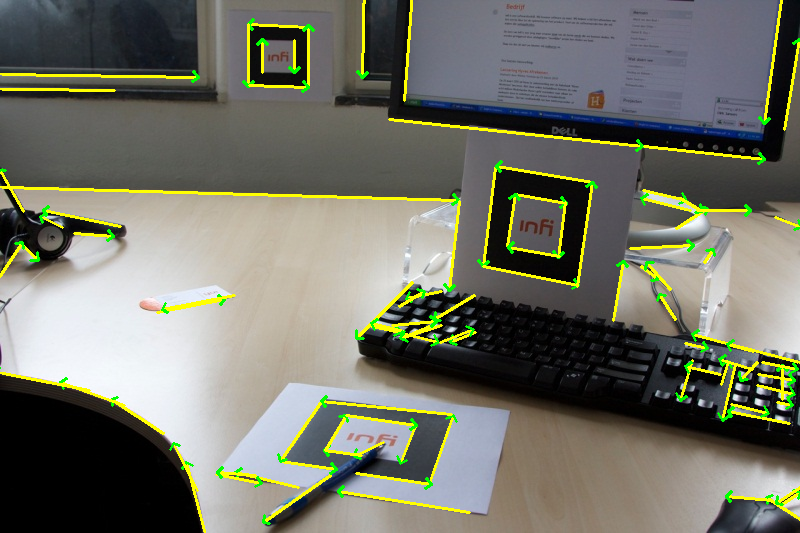
The extended lines are displayed as yellow arrows in the image above. In step 6 and 7 only lines with at least one corner are used.
Step 6: Keep lines with corners
Keep the lines with corners.
Step 7: Find markers
Finally, we try to find all markers in the image.
To detect the markers in the image, we try to find chains of 3 to 4 lines. A chain is a list of lines where the end of one of the lines hits the start of another.
After finding such chains, we only want to keep chains which form a rectangle counter clockwise. These chains will have black ‘inside’ and are probably markers. Knowing the orientation of the lines, a cross product for each two successive line segments in a chain is used to check this condition.
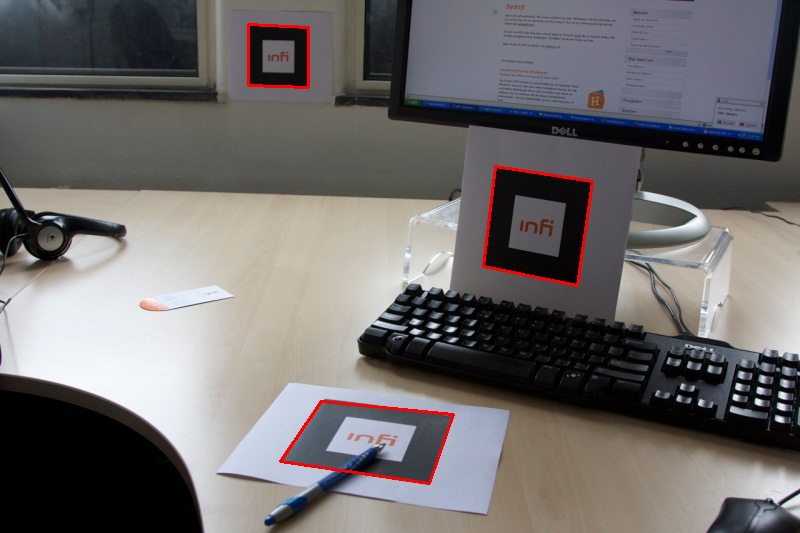
After finding all markers, for each marker, the 4 intersections of the lines in the chain are considered to be the corners. Calculating the positions of corners by these line-intersections gives a robust algorithm. Even if only 3 lines are detected and/or a corner is occluded, the marker will be correctly detected most of the time.
In the image above, all detected markers are displayed as red rectangles. Notice the correctly detected marker at the bottom of the image, although one edge is partially occluded by a pencil.
Now we have the coordinates of the detected markers. The next step would be to identify markers and distinguish them from each other in order to use this algorithm in an augmented reality application, but that will be the next blog :-)
References
- Martin Hirzer, Marker Detection for Augmented Reality Applications, 2008.
- J.C. Clarke, S. Carlsson, and A. Zisserman. Detecting and tracking linear features efficiently, 1996.